.png)
Tokenomics: How App Orchid Minimizes Token Usage
.png)
Your enterprise collects vast quantities of data, from customer transactions and operational metrics to market signals and internal performance indicators. Volume isn't a problem anymore. What's broken is that the insights you're drawing from all of it are often incomplete, misleading, or flat-out wrong.
Traditional analytics tools surface patterns effectively, but they don't tell you how much confidence to place in those patterns. A downward trend in a quarterly report might reflect a genuine shift, or it might be noise. A correlation between two metrics might suggest a cause-and-effect relationship that doesn't exist. Without a measure of reliability, every downstream decision inherits that uncertainty. Understanding why this happens is straightforward; fixing it requires a fundamentally different kind of analytics.
Most analytics tools deliver single-number answers: revenue will grow 8%, churn will decrease by 3%. According to the Federal Reserve Bank of New York's Liberty Street Economics research (one of the most rigorous analyses of forecasting accuracy available), professional forecasters reported 53% confidence in their predictions but were correct only 23% of the time. McKinsey's research on large capital projects tells a similar story: forecasts anchored to single best-estimates systematically overestimate benefits and underestimate costs.
Those numbers should give you pause. They mean that point estimates, the kind most analytics tools produce, offer a false sense of precision. A fundamentally different approach produces a range of outcomes with an associated degree of confidence. Consider the difference between "revenue will grow 8%" and "there's a 75% chance revenue grows between 5% and 12%" is the difference between a guess and a basis for a risk-calibrated decision. As Harvard Business Review has argued for years, leaders who adopt probabilistic thinking, mapping the full range of plausible futures rather than betting on a single number, consistently make better-informed decisions, mapping the full range of plausible futures rather than betting on a single number, consistently make better-informed decisions.
These models evaluate the full range of outcomes consistent with your available data, not just a single best-fit answer.
What you get is confidence intervals: ranges within which the true value is most likely to lie, given everything the data and domain knowledge together support. Narrow intervals signal strong evidence. Wide intervals signal caution, telling you the data doesn't yet support a decisive move.
This is the single most important shift in enterprise analytics today: moving from tools that give you answers to tools that tell you how much to trust those answers. Here's what that looks like in practice. Every insight comes with a quantified measure of certainty, so your leadership team can weigh risk proportionally. Every model is purpose-built for real enterprise data, which is large, noisy, and riddled with missing values and data entry inconsistencies (your data doesn't need to be perfectly clean for this to work).
Under the hood, the platform organizes your enterprise data into a unified knowledge representation that captures the relationships, rules, and context your business already operates by. Seasonal patterns, operational constraints, and market dynamics that your teams already understand are encoded directly into the analysis rather than discarded in favor of a purely data-driven model.
Every model shows exactly which factors influence the outcome, in what direction, and by how much. You can explain the results to a board, a regulator, or an operational team with equal clarity. And when the evidence is insufficient, the confidence ranges automatically widen, signaling that the data doesn't yet support a decisive action. A system that admits uncertainty is inherently more trustworthy than one that projects false confidence.
That covers the "how." The next question is whether you need a data scientist for every one of these analyses.
Building the right model for every business question has traditionally been the bottleneck. It requires a data scientist to scope, build, validate, and interpret each analysis; that doesn't scale when your organization generates dozens of analytical questions a week.
App Orchid's Easy Answers is an analytics platform that connects to your enterprise data sources and makes rigorous analysis accessible to business users. At its core is Quick Insights, a library of pre-built model families (categories of analytical techniques) spanning regression, forecasting, causal analysis, correlation, churn prediction, geospatial modeling, clustering, and statistical testing, with over fifty specialized configurations.
It takes a few clicks: select the relevant data features and outputs through a simple configuration interface, and the system runs the appropriate model and delivers the result. No coding. No model building. Advanced configurations and validation controls remain available for expert teams, and governance safeguards are built into the platform to prevent misuse.
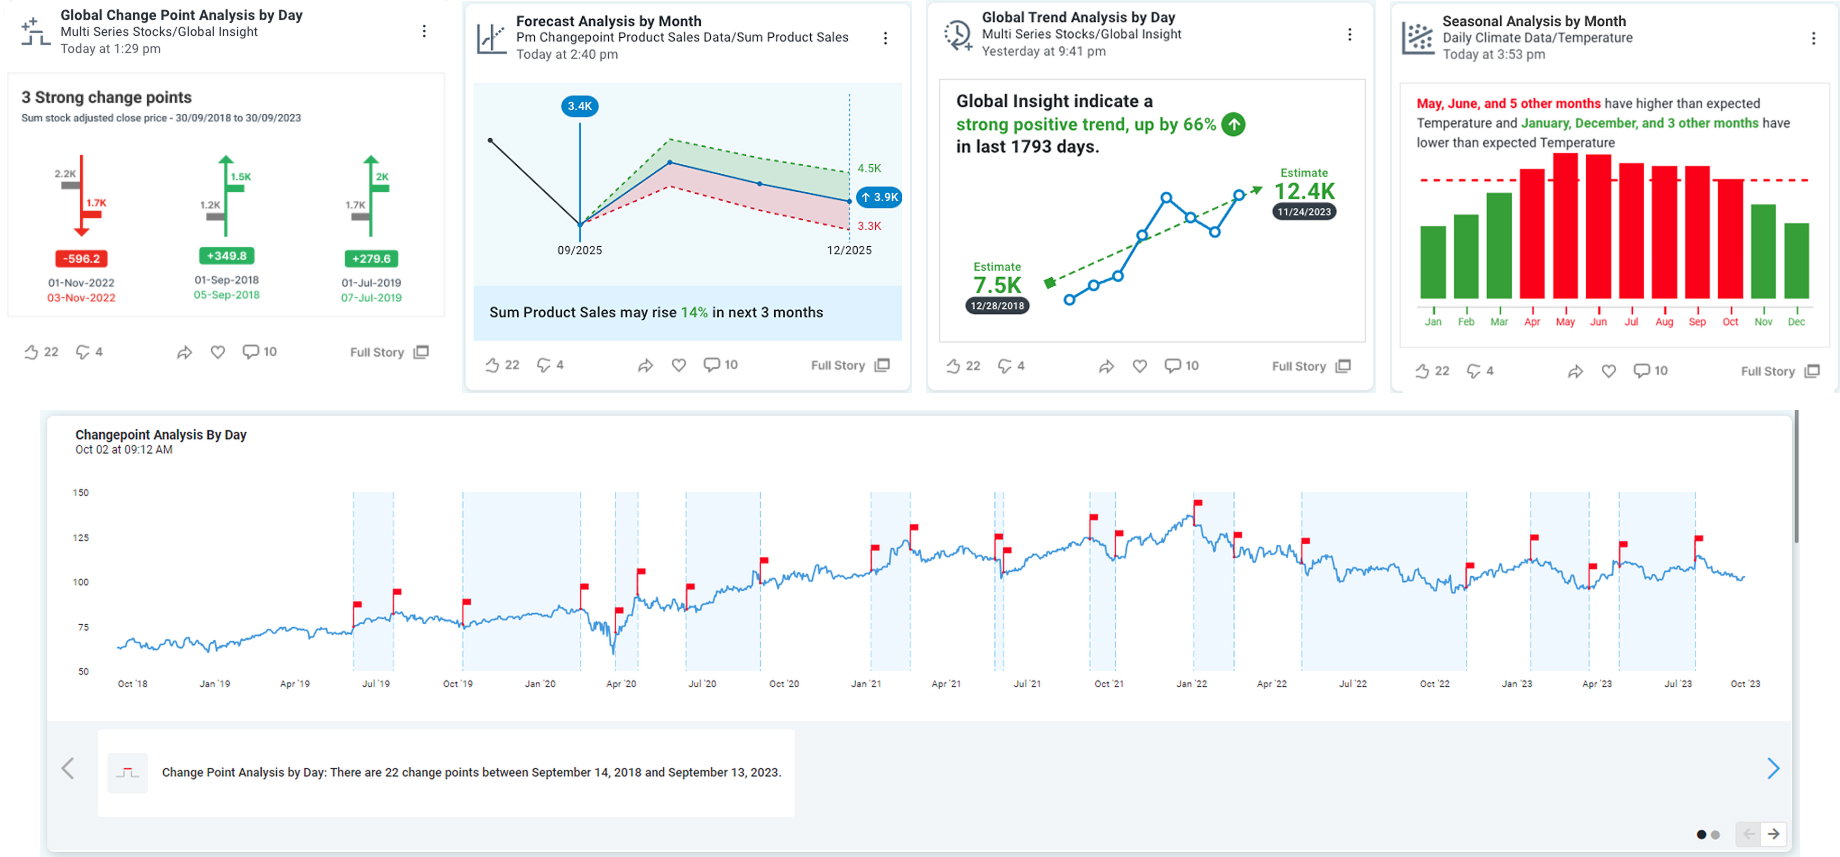
Results come at two levels of depth. At the summary level, an Insights Feed delivers bite-sized Insight Cards you can scroll through like a social media feed, each one distilling a single finding into a clear, consumable format. For those who need to go deeper, every insight is backed by full-length visualizations and automatically generated summaries that surface key observations, patterns, and recommended takeaways.
Here's a sample of the questions these model family's address:
As enterprises accelerate their adoption of AI-driven analytics, this question matters more than ever. For many AI systems, the honest answer is no; they operate as closed systems where the logic between input and output is opaque. That's untenable when accountability and regulatory compliance depend on explainable reasoning.
Quick Inights takes a different approach. Every model documents which variables were considered, how each influenced the outcome, and the degree of confidence in the result. Outputs are structured so they can be understood and defended, whether by a data team, a C-suite executive, or an external auditor.
Every model is developed and documented following the principles of the NIST AI Risk Management Framework (the U.S. government's primary framework for trustworthy AI), covering governance, system mapping, performance measurement, and ongoing risk management. These principles are embedded in how each model is designed, validated, and maintained.
We recommend that any enterprise evaluating AI-driven analytics ask a simple question: can the vendor show you exactly how the model reached its conclusion? If the answer is no, that's a dealbreaker. Transparent models, confidence-calibrated outputs, and rigorous governance documentation aren't optional; they're the baseline for enterprise-grade AI.
Trustworthy models are necessary. But they also need to scale.
Generating rigorous insights is one challenge; generating them at the pace and volume your enterprise demands is another. When every analytical question requires a specialist to build and validate a custom model, your organization's capacity for insight is capped by the size of its data science team, and the backlog grows faster than the team can work through it.
Quick Insights breaks that constraint in two ways. First, the models are pre-built and domain-agnostic, meaning they can be applied across industries without customization. Routine analytical questions no longer require specialist involvement; insights become available at the speed of the question, not the speed of model development.
Second, the models are composable. Simple analyses combine into sophisticated ones without starting from scratch. Your organization can grow its analytical maturity progressively: from autonomous routine insights, to composable analyses for complex questions, to fully custom models, all on a single foundation.
Your specific results will depend on the maturity of your data infrastructure, the complexity of your analytical questions, and how deeply your teams adopt the platform. But the operational shift is consistent: analytical rigor becomes a continuous capability, not an occasional specialist exercise. And because the models are domain-agnostic, that capability applies regardless of your industry.
Quick insights ships with built-in models that solve real operational problems across industries. Here are five examples.
The shift that model-driven intelligence enables isn't a technology upgrade; it's an operational one. When every business question can be answered with a rigorous, transparent, and confidence-calibrated insight in seconds, the constraint moves from "do we have the data?" to "are we asking the right questions?"
We think the enterprises that will lead over the next decade are the ones that stop treating analytics as a back-office function and start embedding it into daily operations, available to every decision-maker, continuously, without a specialist in the loop.


Experience a future where data and employees interact seamlessly, with App Orchid.

.png)